Sales dashboard.
Website sales and invoicing by location, with targets, year-on-year comparison and alerts when the data stops arriving.
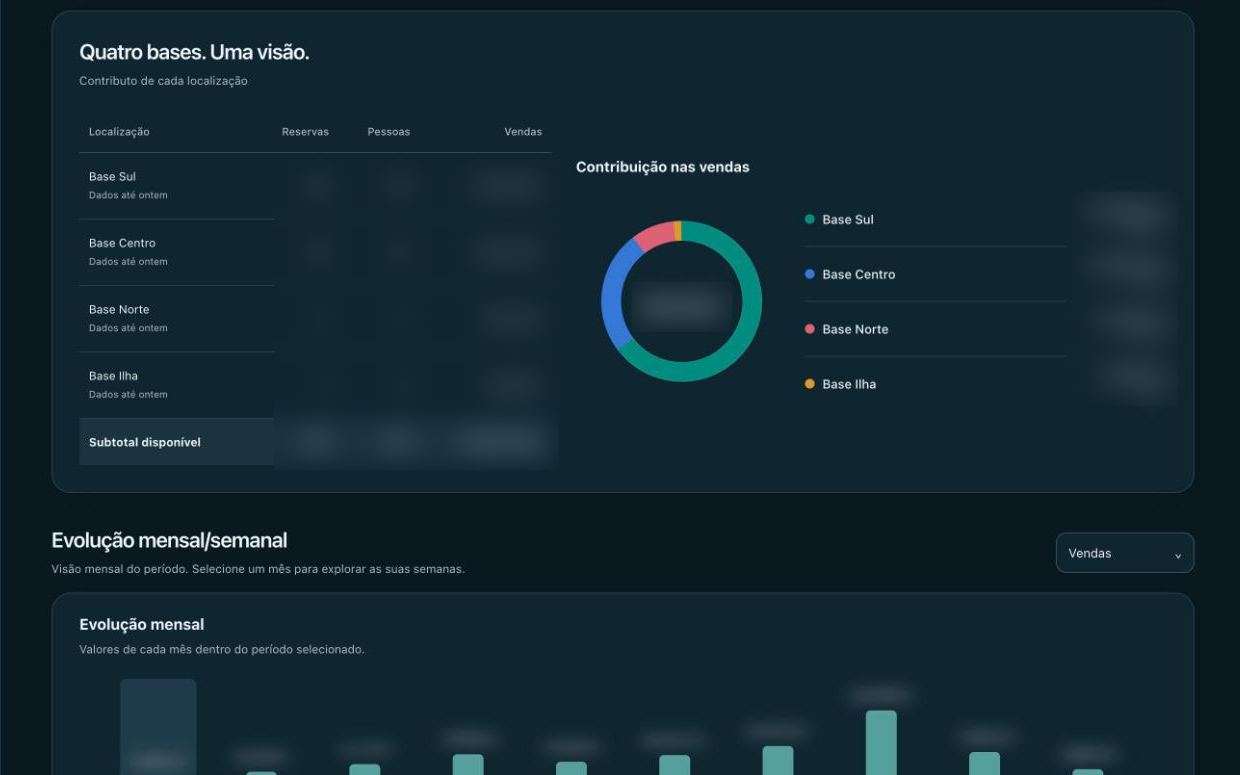
- 5bases on one dashboard, compared side by side
- 1×per day: data arrives on its own from the booking system
- 0manual exports to see the month
- 1e-mail alert when a collection fails
Starting point
Sales lived in the booking system, invoicing somewhere else and the comparison with last year in a spreadsheet. Every update cost hours of work in Excel: exporting the data, formatting the files, rebuilding pivot tables, filters and conditional formatting, running macros, assembling summary tables and charts. And the next day it was all out of date again.
What we built
A dashboard that collects website sales every day, without intervention, and crosses them with invoicing by base: each location’s contribution, targets, year-on-year comparison and monthly evolution. Owner-only sections, such as fleet costs, sit behind their own access.
When a collection fails — for example when the computer running it is out of power — the dashboard warns by e-mail and explains how to recover, instead of silently showing stale numbers.
What changed
Now it does not take a single click: the data arrives on its own, the dashboard is always up to date and the hours of Excel are gone. The month is visible on one screen, per base, with last year alongside. Data failures went from invisible to alerts with instructions.